


Application scalability starts with measuring the application, and adding servers comes after. Profile it, load test it until it breaks, and find out what every dependency costs you. Then watch latency, traffic, errors and saturation in production, and fix the bottleneck you can see. On Compot, a sub-250 ms p95 at launch was a target we set and measured against.
This guide walks through how we do that, in the order we do it.
Measure before you scale
Effective scalability begins with a data-driven understanding of your application's operational needs. Accurately forecasting resource requirements is essential for preventing both over-provisioning, which incurs unnecessary costs, and under-provisioning, which risks system failure.
Adding servers is the most expensive way to find out where your application is slow. The cause is often a handful of operations doing far more work than they need to: a file processed inside the request, a query that scans a whole table, two threads fighting over one lock. Measuring first tells you which one you have and how much capacity you really need. It also stops you paying for capacity you'll never use, which is the quieter way to get scaling wrong.
Profile the application
Start with the profiler for your stack: JProfiler or the IntelliJ profiler for Java, cProfile for Python, pprof for Go. Run the application and walk through every user flow while it records. Upload and download files, trigger the heavy processing, submit the forms.
You're looking for two things. The first is where time and CPU go, which tells you where optimisation will pay off: a thread race, a slow query, a file pipeline that needs re-engineering. The second is memory that gets allocated and never released. A leak shows up as memory that keeps climbing the longer you use the application, and it's far cheaper to find on a laptop than in production.

Load test to find the breaking point
Profiling covers one user at a time, so the next step is a load test. We use k6; Apache JMeter and Gatling do the same job. Raise the load step by step and record two numbers: the requests per second a single instance handles comfortably, and the point where latency or errors start to climb. Those two numbers are your baseline, and every scaling decision afterwards gets measured against them.
Most of these tools can record a session in the browser and turn it into a replayable script. Record the real user flows once, then edit the script or replay it as often as you need.

Map your dependencies
Your application is only as fast as the slowest dependency on its critical path: the database, the cache, a third-party API. If a payment provider takes 400 ms to answer, a 250 ms p95 is off the table for that flow, however fast your own code is. Map every dependency and measure what it costs per request. Do it before launch, while the architecture can still change.
Availability works the same way. A service that needs three dependencies to answer a request can't be more available than the three of them together, and AWS shows the maths. Check the SLAs of what you depend on before you promise one of your own.

Monitor the four golden signals
Google's SRE book names four golden signals worth watching on every user-facing service, and we build our dashboards around them:
- Latency: how long a request takes. Watch p95 and p99 as well as the average, because the average hides the slow requests, and those are the ones users notice under load.
- Traffic: how much demand reaches the system, usually in requests per second.
- Errors: the share of requests that fail. A sudden rise is usually the first sign of a fault.
- Saturation: how close CPU, memory and disk I/O are to their limits. High saturation means a service is running out of headroom.
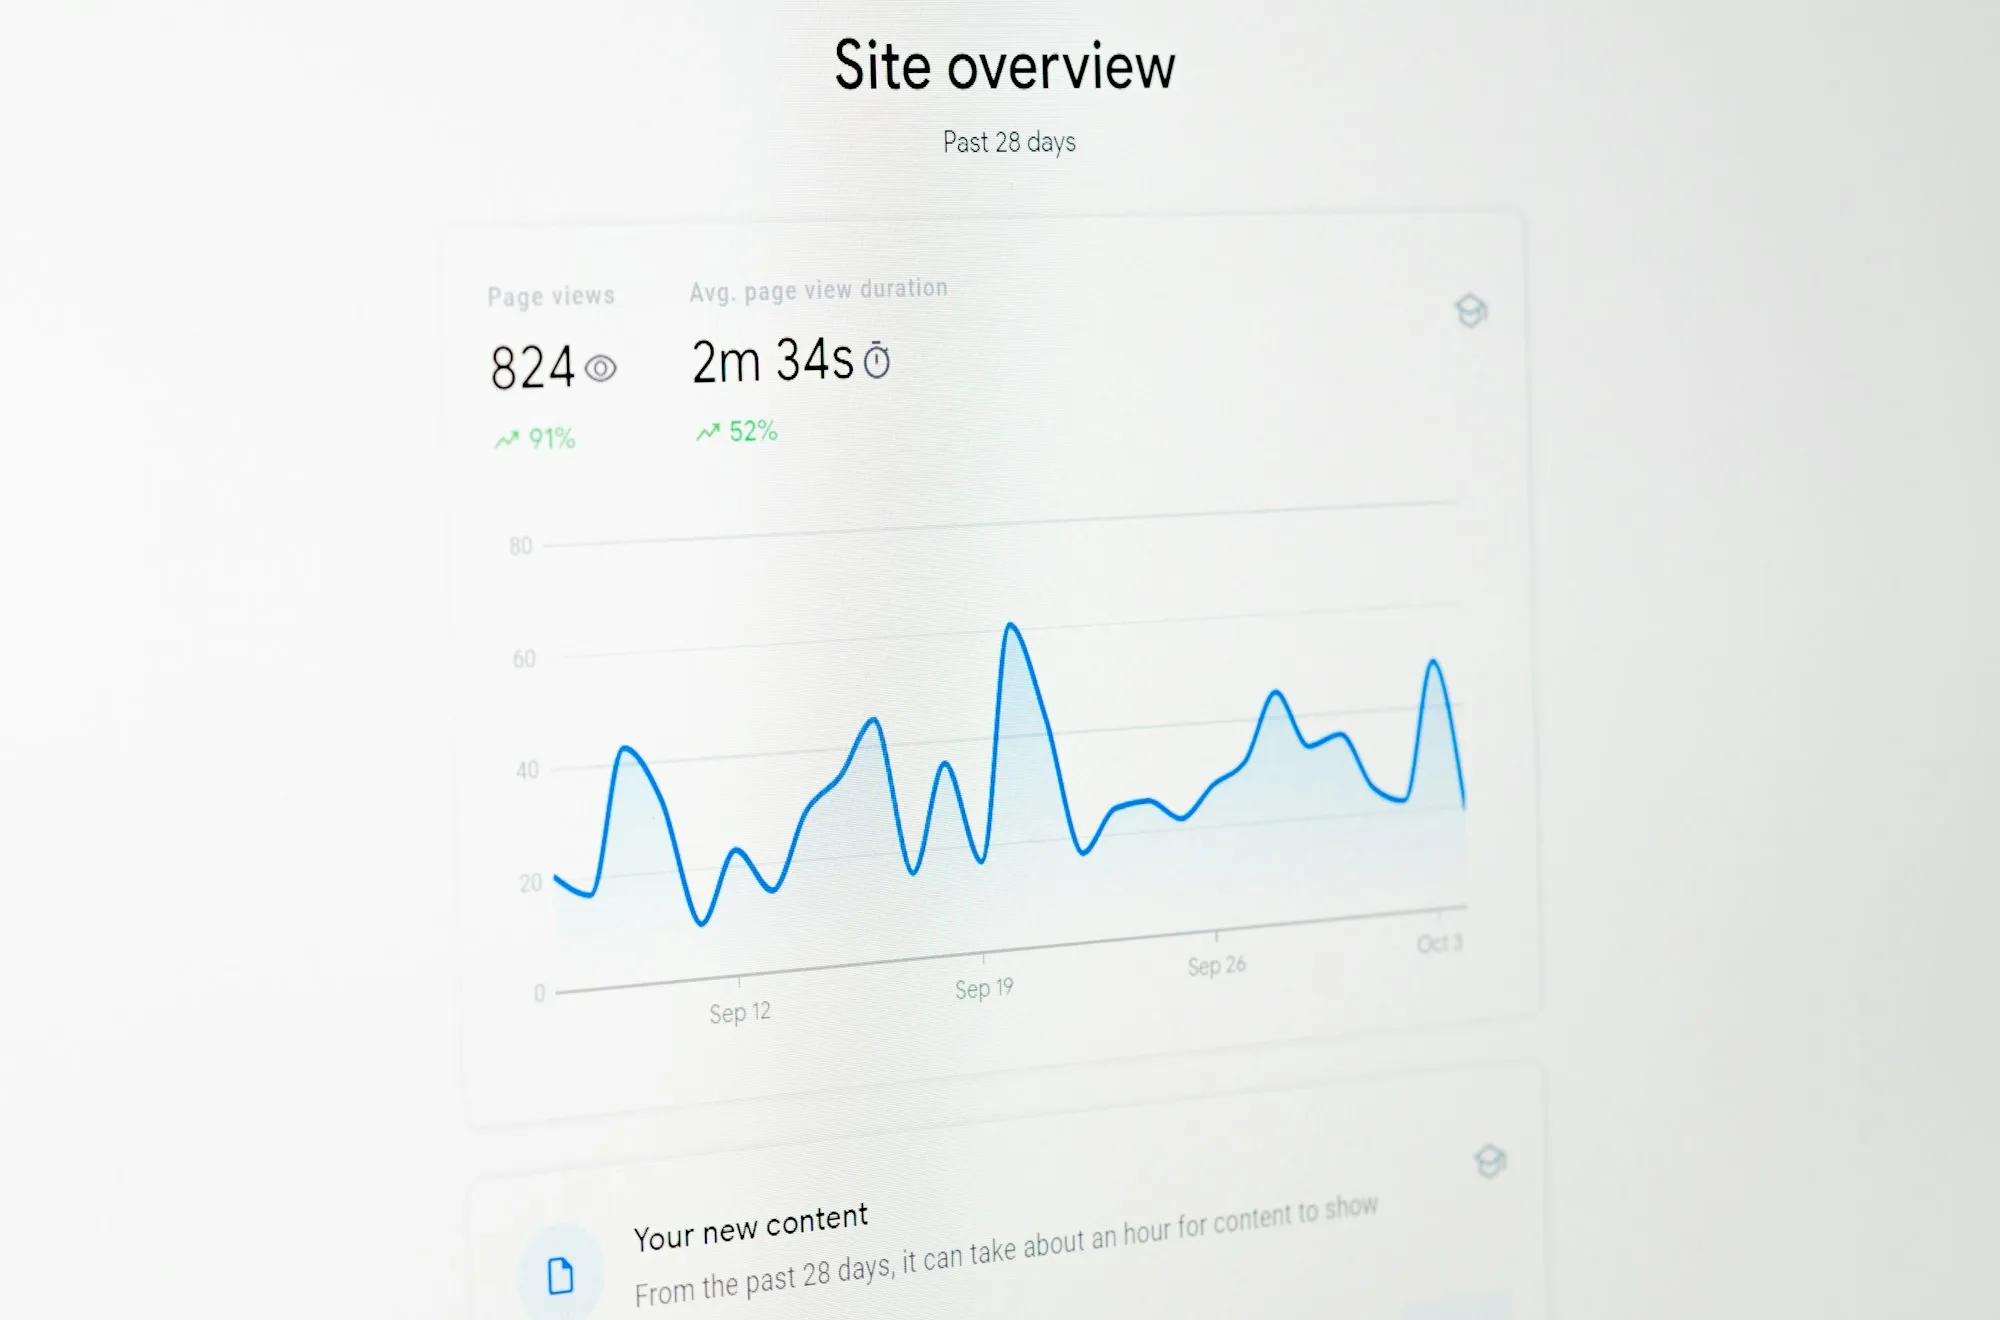
We use Axiom for metrics and the dashboards. Putting all four signals for every service on one screen is what makes patterns visible. A drop in requests per second next to a spike in CPU, for example, usually points to a blocking operation.
Trace requests end to end
Metrics tell you something is slow. Tracing tells you where. One request can pass through a frontend, an API, two internal services and a database, and the delay can sit in any of them. Distributed tracing follows the request through each hop and shows how long it spent in each one.
For open-source tracing, look at Jaeger, Zipkin and Grafana Tempo. Commercial APM platforms such as Datadog, New Relic and Sentry bundle tracing with metrics and logs.
How we troubleshoot a traffic surge
When traffic spikes, the order of the checks matters more than speed. We go through the same steps every time:
- Dashboards. The four golden signals show what changed and when: more traffic, slower responses, more errors, or a resource at its limit.
- Logs. Query the central log store for errors and warnings around the moment it started, and look for a pattern: one endpoint, one client, one service. Ours go to Axiom.
- Recent deployments. A fresh code or configuration change is one of the most common causes of sudden instability. Check what shipped in the hours before.
- The bottleneck. Traces and metrics narrow it to one component, and its profile tells you what kind of problem you have:
- CPU-bound: inefficient code, or not enough compute.
- Memory-bound: a leak, or instances that are too small.
- I/O-bound: database contention or slow disks. Query optimisation or a missing index usually fixes it before new hardware does.
Not every surge is good news.
On a large platform where I was technical lead, a sudden spike in traffic turned out to be a DDoS attack on our customer. We traced the attack to its origins and blocked them at the firewall. The attackers rotated to new IP addresses, so blocking them one at a time stopped working. We moved to rate limiting per origin instead: every source got a request budget, and each new address the attackers rotated in hit the same ceiling as the last one. Blocking dealt with the first wave. The rate limit is what held when the attack changed shape, and it costs very little to set up before you need it.
Which fix for which bottleneck
Once you know where the bottleneck is, the fix is usually one of a few well-known patterns. The useful question is what each one costs you.
| Symptom | Fix | Trade-off |
|---|---|---|
| Servers busy delivering images, CSS and JavaScript | A CDN serves static assets from edge locations close to the user | Cache invalidation becomes part of every release |
| A predictable peak, such as a planned campaign | Manual scaling: more instances (horizontal) or a bigger machine (vertical) | Someone has to watch and act, but costs stay predictable |
| Unpredictable load | Autoscaling on CPU or request count, with Kubernetes or AWS Auto Scaling Groups | Without caps, costs scale with traffic, attacks included. Set limits before you turn it on |
| One instance overloaded while others sit idle | A load balancer spreads requests across instances | One more component to configure and monitor |
| The same expensive reads, over and over | A cache such as Redis or Memcached | Stale data, and an invalidation strategy to design |
| One client, or one attacker, flooding an API | Rate limiting per client or origin | Legitimate bursts can get throttled, so the limits need tuning |
| A failing downstream service dragging its callers down | A circuit breaker stops calls until the service recovers | Callers need a fallback for when the circuit is open |
Scale for the load you can forecast
Building for traffic you may never get has a daily cost: more moving parts, slower changes, and a system that is harder to hire for. We design for the load we can forecast, leave seams where growth would go, and measure before we tune. That's how Compot launched with a sub-250 ms p95, a target we set up front and measured against.
Scalability also depends on the codebase. The habits that keep code maintainable on fast-moving projects are the same ones that let you change a system safely when the load changes. If you're planning for growth, see how we approach custom software development.
